Policy Controller dashboard: Now available for all Anthos and GKE environments
Poonam Lamba
Product Manager, Google Cloud
Customers using Kubernetes at scale need consistent guardrails for how resources are used across all their environments to improve their security, resource management and flexibility, and to achieve faster time-to-market and better operational efficiency.
At the same time, customers tell us they need an easy way to apply and view those policy guardrails, including enforcement status, violations and remediation recommendations for their fleet of clusters. In January 2023, we launched the Policy Controller dashboard along with out-of-the-box policy bundles. And now, the Policy Controller dashboard is available for all Google Kubernetes Engine (GKE) and Anthos environments (i.e., on-premises, multi-cloud and attached clusters) and includes a powerful flow to help remediate violations.
Policy Controller lets you enforce fully programmable policies for your cluster resources that act as "guardrails" and prevent any changes from violating security, operational, or compliance controls. Policy Controller can help accelerate your application modernization efforts by helping developers release code quickly and safely. Here are some examples of policies that you can audit or enforce with Policy Controller:
All container images must be from approved repositories
All ingress hostnames must be globally unique
All pods must have resource limits
All namespaces must have a label that lists a point-of-contact
Resources running on my fleet of clusters should be CIS-K8s benchmark-compliant
Resources running on my fleet of clusters should be PCI-DSS benchmark-compliant
The Policy Controller dashboard
With the Policy Controller dashboard, meanwhile, platform and security admins can:
Get an at-a-glance view for the state of all the policies applied to the cluster fleet, including enforcement status (dryrun, warn, or enforced)
Easily troubleshoot and resolve policy violations by referring to opinionated recommendations for each violation
Get visibility into the compliance status of cluster resources
The Policy Controller dashboard is designed to be user-friendly and intuitive, making it easy for users of all skill levels to manage and monitor violations for their fleet of clusters, with a centralized view of policy violations that they can act on if necessary.
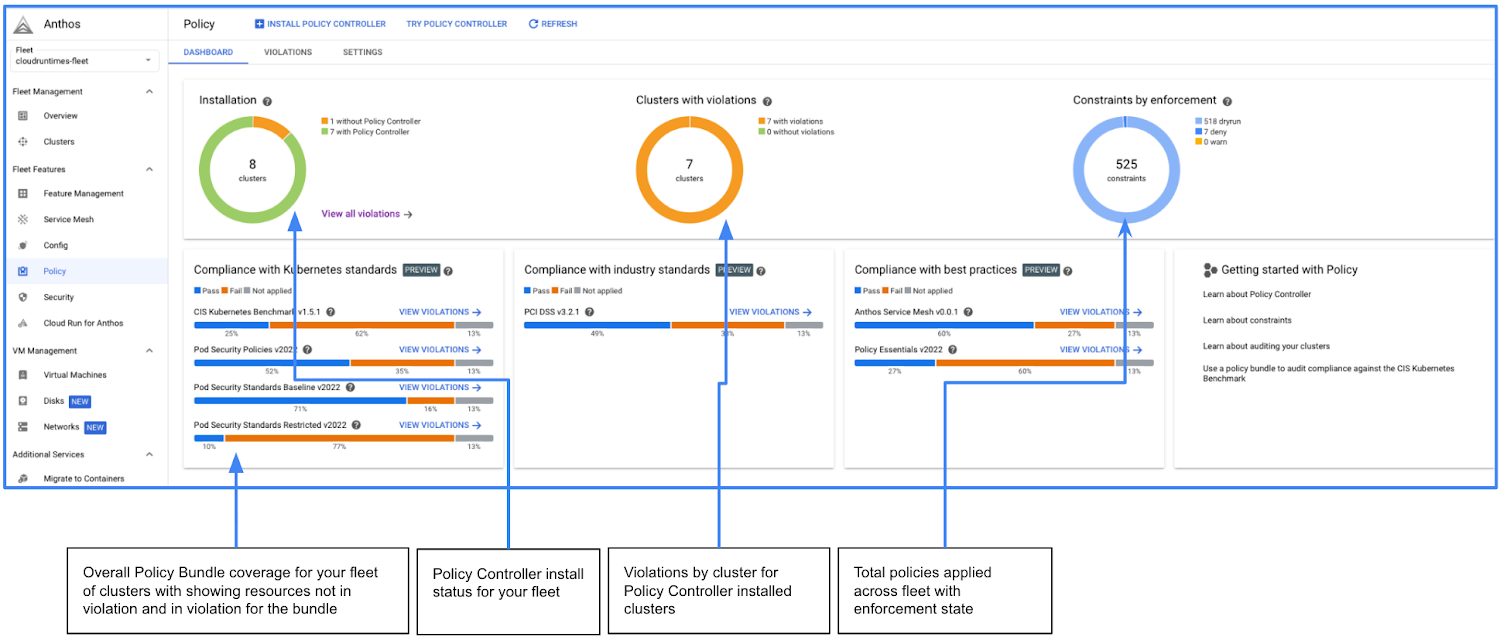
The circular “donuts” on the dashboard above show you the state of policies across all environments, including Policy Controller’s overall install status, any clusters that are in violation, and the total policies applied across the fleet of clusters. Enforcement action shows if you are just auditing your resources against policies or enforcing the policies at admission time on your clusters.
The bottom part of the Policy Controller dashboard page shows the coverage for each policy bundle for your fleet, breaking it down into percentage of resources that are compliant or in violation with this bundle:
A fully grayed-out bar implies that the bundle is not applied to this fleet of clusters. If the bar is partially grayed-out, it means that the bundle has not been applied to one or more clusters in the fleet.
If one or more bundles are applied, overall compliance for your resources is calculated against the bundle. The blue portion of the bar shows the resources that are in compliance with the policy, while orange represents the violations.
For each bundle, you can click on the violations link, which will take you to the detailed Violations tab depicted in the image below.
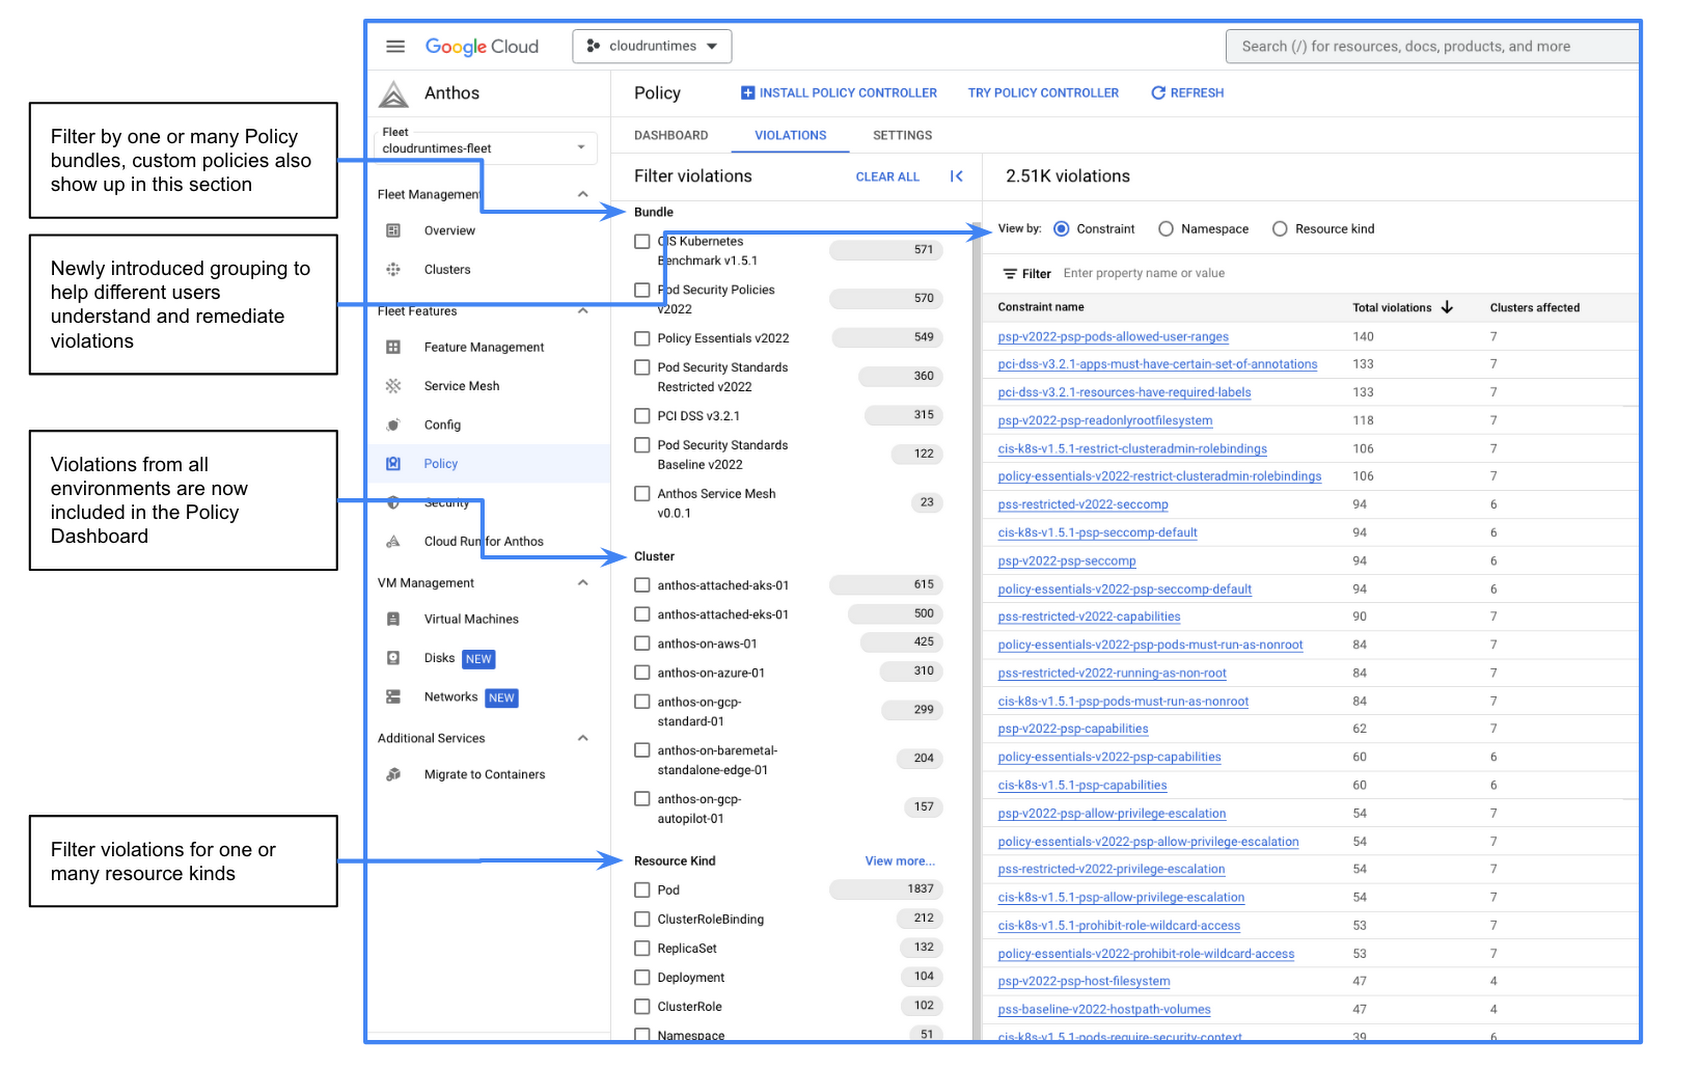
The Violations tab lets you filter violations based on things like cluster, bundle, or resource type. Furthermore, you can now group violations by constraint and namespace to help different user personas do their jobs more efficiently. From either one of the groupings, users can click on the constraint link which will show the Constraint view as shown below.
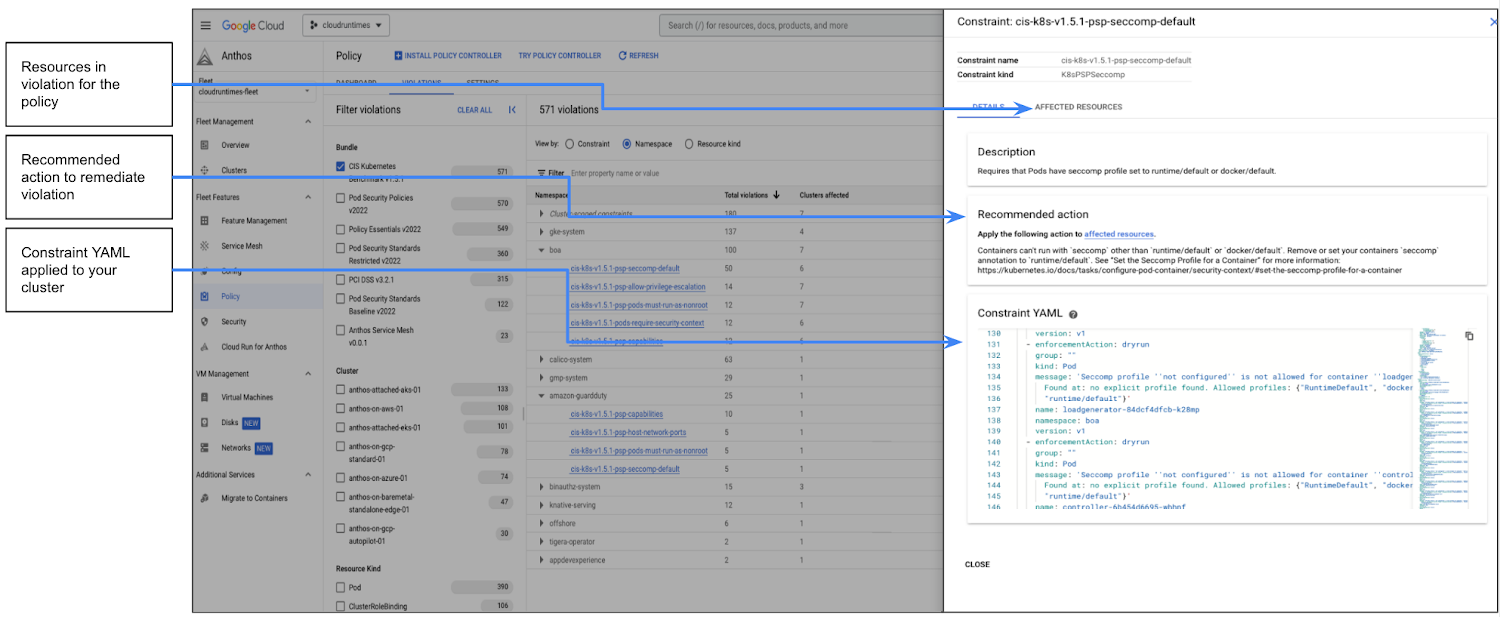
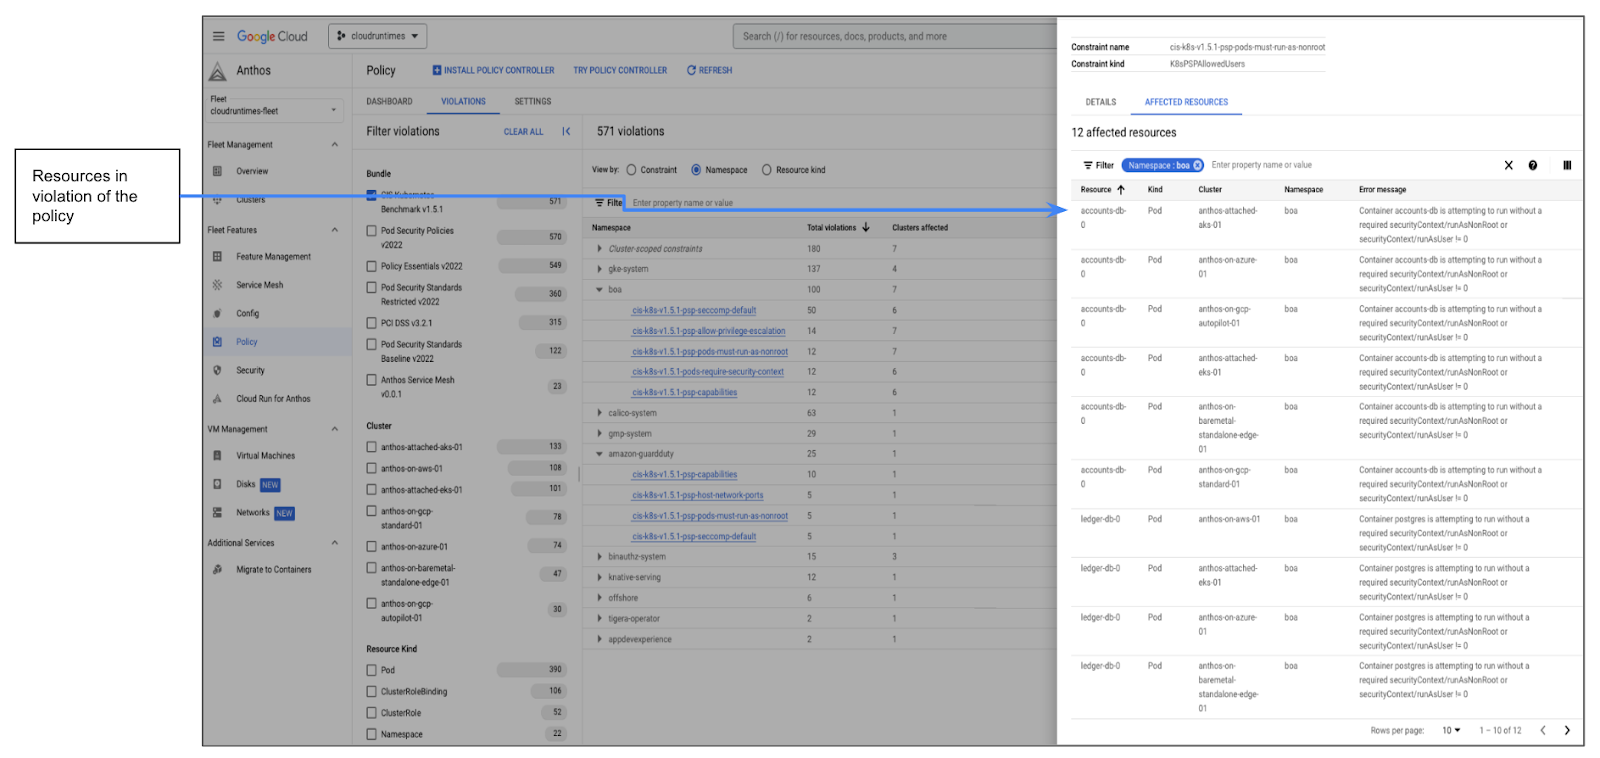
The Constraint details tab describes the constraint, and shows the recommended action to fix the violations against the constraint and affected resources. You can also view the constraint’s YAML as it exists on your clusters. The affected resources tab lists all the resources that are in violation of the constraint with a detailed error message as shown in the image below.
Get started today
We continue to invest in building out fully managed Policy features for GKE and Anthos, focusing on ease-of-use, out-of-the-box content, and a more integrated Google Cloud experience. To get started with Policy Controller, simply install Policy Controller and try applying a policy bundle to audit your fleet of clusters against a standard such as the CIS Kubernetes benchmark. You can also try Policy Controller to audit your cluster against the Policy Essentials bundle. Stay tuned to learn more about the latest features in Policy Controller in our next blog post, and we hope you join us at Next ’23 to learn more.