
Linux is a powerful and widely-used operating system used by individuals, businesses, and organizations around the world. With its open-source nature and customizable features, Linux has become a popular choice for those seeking a reliable and efficient system for their computing needs.
However, with this power and flexibility also comes the need for proper monitoring and management. As more and more businesses and individuals rely on Linux for their daily computing needs, the demand for effective monitoring tools has also increased.
Whether you are a system administrator, a developer, or an avid Linux user, having the right tools to monitor your system's performance, resource usage, and security is crucial.
With the vast array of monitoring tools available, it can be overwhelming to determine which ones are essential. That's why we have compiled a list of the top 15 monitoring tools for Linux that everyone should have in their toolkit. These tools offer a variety of features, from real-time system monitoring to network management, making them invaluable for any Linux user.
Table Of Contents:
- Linux Monitoring Paramountcy
- Best Open-Source Linux Monitoring Tools
- Best Closed-Source Linux Monitoring Tools
Linux Monitoring Paramountcy
Monitoring Linux systems is crucial for several reasons.
Firstly, it helps ensure the stability and performance of the system by identifying and addressing potential issues before they escalate into major problems.
By continuously monitoring various metrics such as CPU usage, memory usage, disk space, and network activity, administrators can detect anomalies and take proactive measures to optimize resource utilization and prevent bottlenecks.
Secondly, monitoring allows administrators to track system health and availability, ensuring that critical services are up and running smoothly. This is particularly important in environments where downtime can have significant financial or operational consequences. Monitoring tools can alert administrators to service outages or performance degradation, enabling prompt troubleshooting and resolution.
Additionally, monitoring plays a key role in security by providing insights into system activity and detecting suspicious behavior or unauthorized access attempts. By monitoring system logs, file integrity, and network traffic, administrators can identify security breaches and implement appropriate countermeasures to mitigate risks and protect sensitive data.
There are various methods and tools available for monitoring Linux server. One common approach is to use command-line utilities such as top, vmstat, and iostat to retrieve real-time system metrics and performance data. These tools provide valuable insights into resource usage and system activity, allowing administrators to diagnose performance issues and optimize system configuration.
In addition to command-line utilities, there are numerous third-party monitoring tools specifically designed for Linux systems. These tools offer advanced features such as customizable dashboards, alerting capabilities, historical data analysis, and integration with other systems and services.
These tools typically operate by collecting data from various sources such as system logs, performance counters, and application metrics, and presenting it in a centralized interface for easy analysis and visualization. They often support a wide range of metrics and provide flexible configuration options to meet the specific monitoring requirements of different environments.
Best Open-source Linux Monitoring Tools
I hope the earlier emphasis on monitoring Linux systems finds you looking for the best monitoring solutions available out there. In this blog, I’ve separated open-source tools, freemium versions, and paid versions for business enterprises to aid you in the same. Let’s start with the open-source tools:
1. Icinga 2
Icinga 2 is a powerful and scalable monitoring solution that is designed to monitor large, complex environments. It offers features such as flexible notification schemes, advanced monitoring capabilities, and support for distributed monitoring setups.
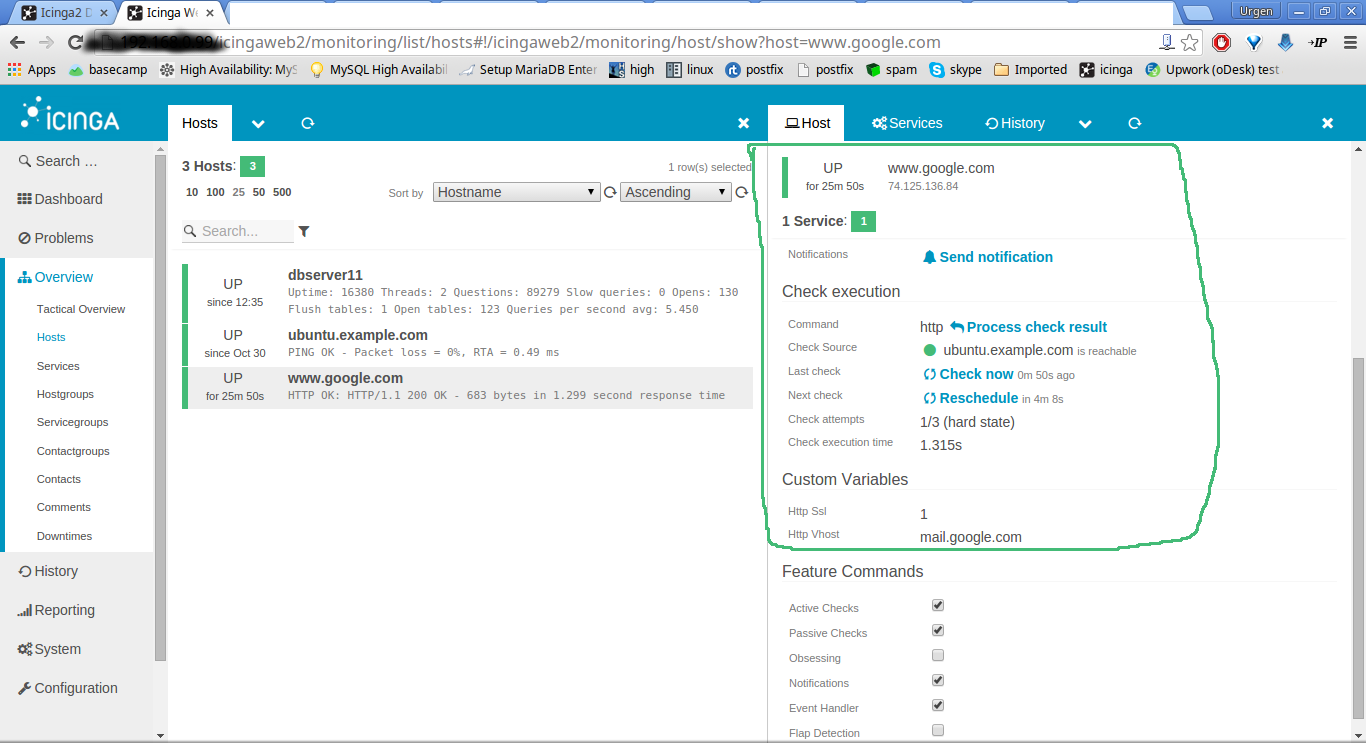
Feature Highlights:
- Supports monitoring of various IT infrastructure components including servers, applications, services, and network devices.
- Designed to scale horizontally and vertically, making it suitable for small to large environments.
- Offers robust alerting capabilities with support for flexible notification methods including email, SMS, and integrations with third-party services.
- Allows for distributed monitoring setups with master and satellite nodes, providing redundancy and fault tolerance.
- Provides extensive configuration management features with support for version control systems like Git.
2. Cacti
Cacti is a network graphing solution that uses the Simple Network Management Protocol (SNMP) to monitor and graph network traffic and performance metrics. It provides a web-based interface for creating custom graphs and visualizations of network data.
Feature Highlights:
- Offers graphical representation of system performance data through customizable graphs and charts.
- Supports SNMP (Simple Network Management Protocol) monitoring for tracking network device performance and status.
- Provides a data collection mechanism that gathers performance data at regular intervals for analysis and reporting.
- Features an intuitive web-based interface for easy navigation and configuration.
- Allows users to create and apply templates for consistent monitoring configuration across multiple devices.
3. Zabbix
Zabbix is a popular server monitoring software for linux that offers a wide range of other monitoring capabilities as well, including network monitoring, application monitoring, and more. It features a flexible and customizable architecture, support for agentless monitoring, and extensive reporting and alerting capabilities.
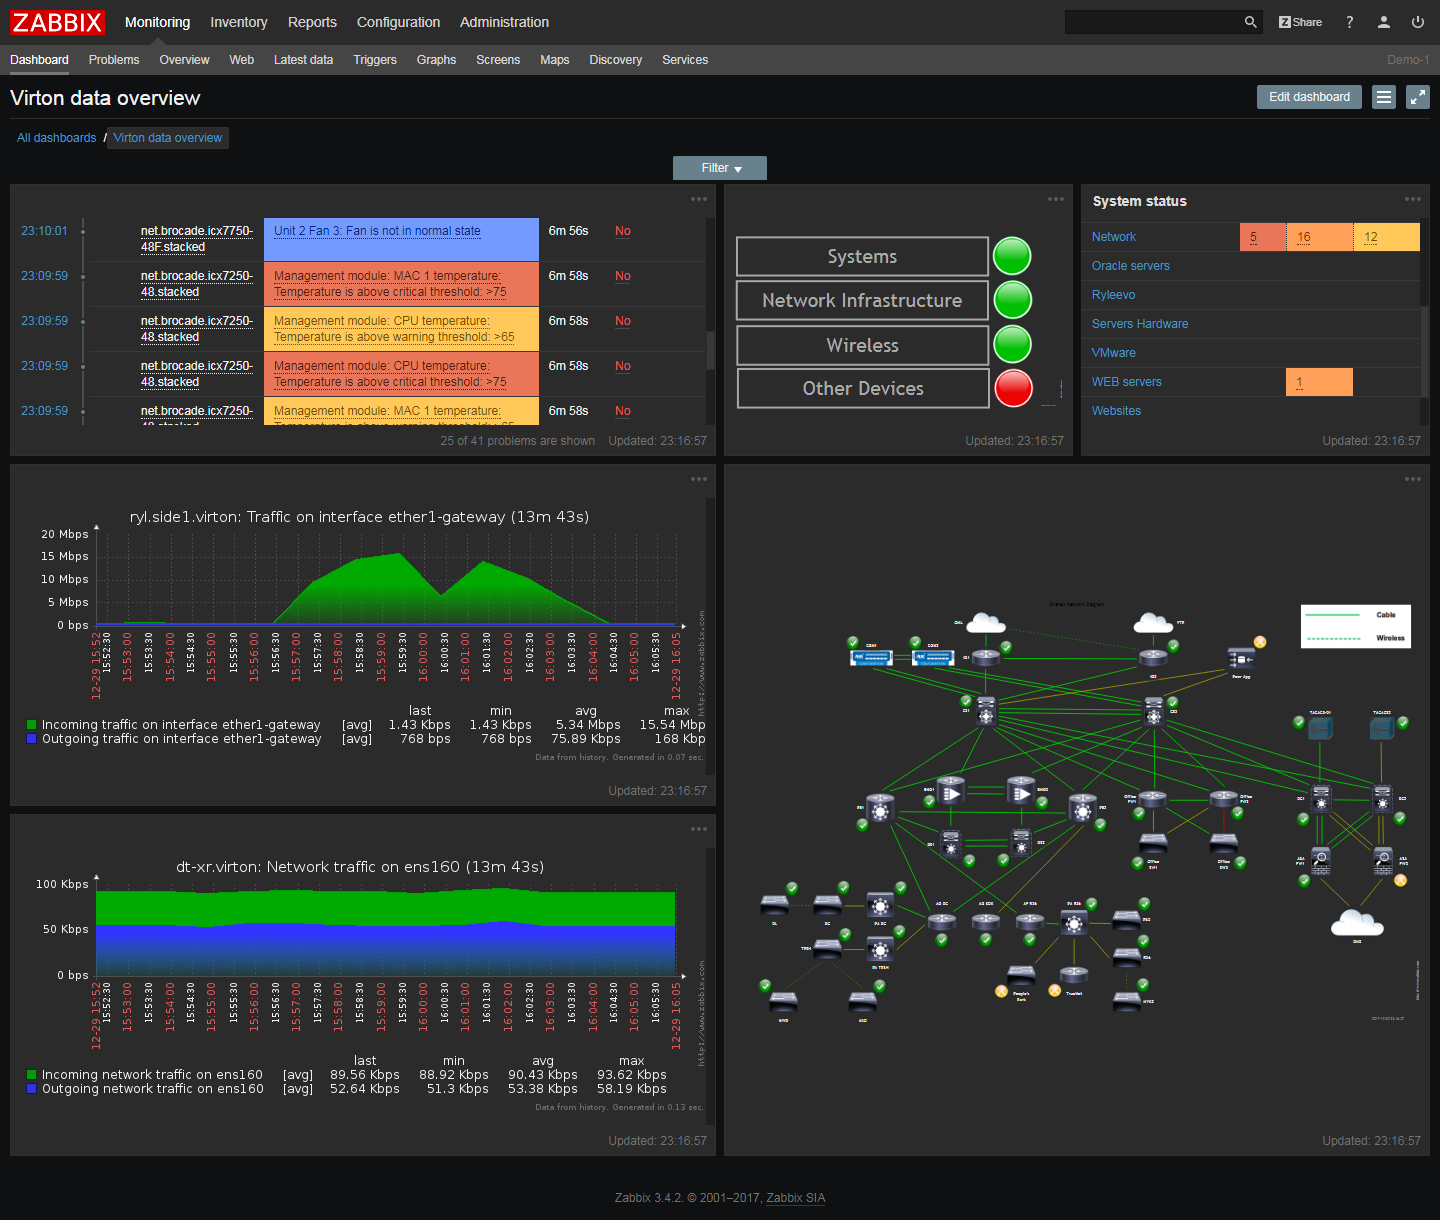
Feature Highlights:
- Offers server monitoring for linux, virtual machines, network devices, and cloud environments.
- Automatically discovers and monitors new devices and services added to the network.
- Provides customizable dashboards with support for widgets and visualization options.
- Features flexible alerting and notification mechanisms based on predefined triggers and thresholds.
- Allows for long-term storage and analysis of historical performance data to identify trends and patterns.
4. Pandora FMS
Pandora FMS is an all-in-one monitoring solution that provides monitoring of servers, networks, applications, and more. It offers features such as auto-discovery, customizable dashboards, and event correlation to help streamline monitoring and troubleshooting.
Feature Highlights:
- Provides unified monitoring for IT infrastructure, applications, and services from a single platform.
- Supports both agent-based and agentless monitoring methods to accommodate diverse monitoring needs.
- Offers event correlation capabilities to identify and correlate related events for better incident management.
- Allows users to generate customizable reports with various visualization options for performance analysis and trend tracking.
- Available in both community and enterprise editions, catering to the needs of different users.
5. Libre NMS
LibreNMS is a fork of the Observium network monitoring tool and is designed to provide auto-discovery, monitoring, and alerting for network devices. It offers support for a wide range of devices and protocols, as well as features such as historical data collection and visualization.
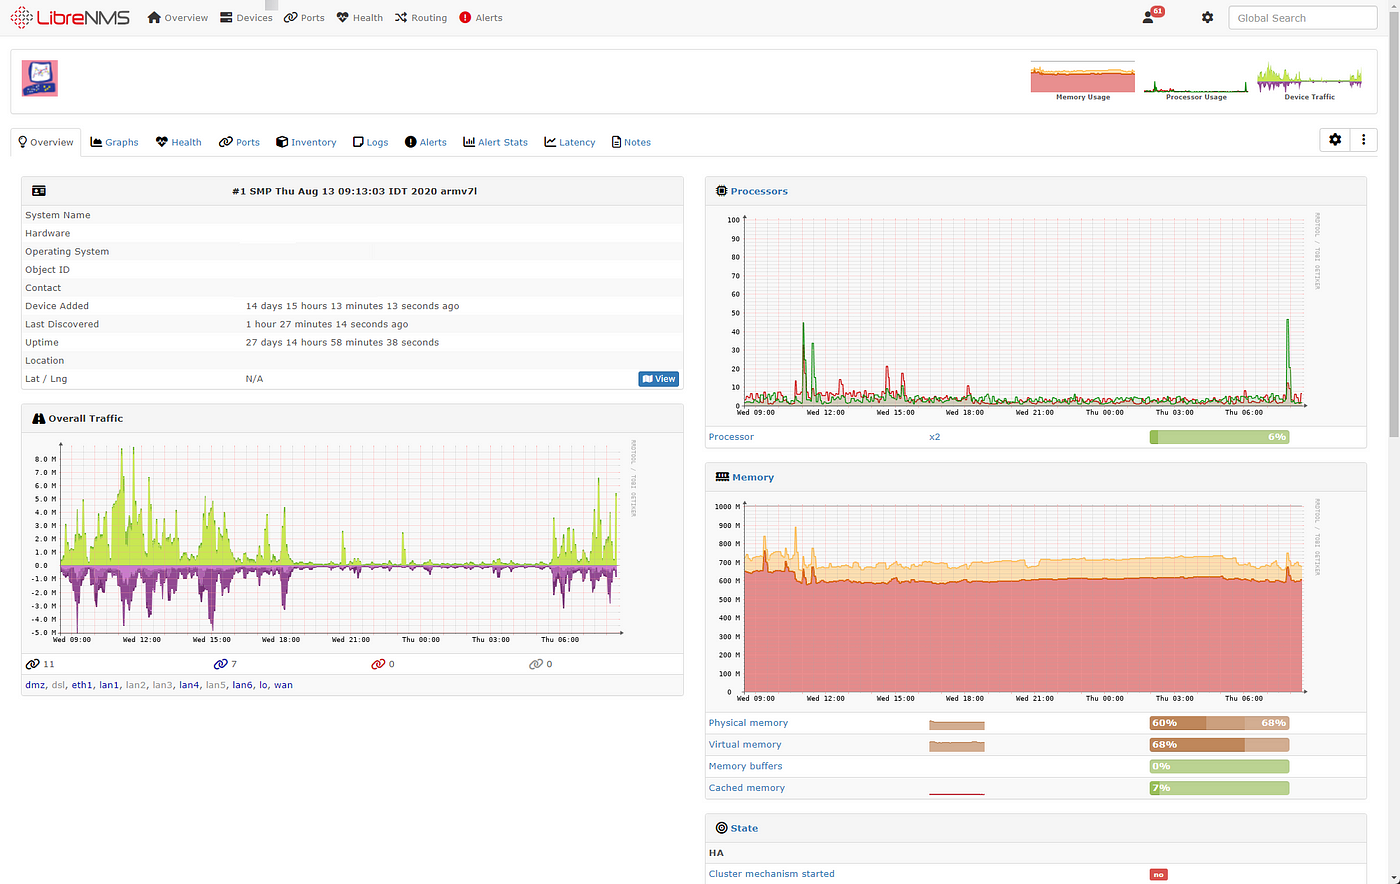
Feature Highlights:
- Automatically discovers network devices and maps their interconnections for visualization and monitoring.
- Uses SNMP protocol for monitoring network devices, interfaces, and performance metrics.
- Provides alerting and notification features to notify administrators of potential issues or outages.
- Offers integration with external tools and services for extended functionality and automation.
- Developed and maintained by a vibrant community, ensuring regular updates and contributions.
6. Prometheus
Prometheus is a monitoring and alerting toolkit that is designed for reliability and scalability. It features a multi-dimensional data model, flexible query language, and powerful alerting capabilities. Prometheus is particularly well-suited for monitoring cloud-native applications and dynamic environments
Feature Highlights:
- Collects metrics from monitored targets using a pull-based approach, making it suitable for dynamic environments.
- Uses a multi-dimensional data model and a powerful query language for efficient data analysis and visualization.
- Supports service discovery mechanisms for dynamic environments, including Kubernetes, Docker, and cloud platforms.
- Allows users to define alerting and recording rules based on custom criteria for proactive monitoring and alerting.
- Offers a rich ecosystem of integrations with various exporters, libraries, and visualization tools for extended functionality.
7. DStat
Dstat is a versatile system monitoring tool that provides real-time statistics for system resources such as CPU, memory, disk, and network usage. It offers a wide range of options for customizing output and can be used for performance analysis, troubleshooting, and benchmarking.
Feature Highlights:
- Provides real-time monitoring of system resources including CPU, memory, disk, and network utilization.
- Supports various output formats including plain text, CSV, JSON, and HTML for easy integration with other tools and systems.
- Features a plugin architecture that allows users to extend functionality and add custom metrics or data sources.
- Collects a wide range of system statistics and performance metrics for in-depth analysis and troubleshooting.
- Offers a simple and intuitive command-line interface for easy invocation and usage.
8. Nagios Core
Nagios Core is one of the oldest open-source IT infrastructure monitoring architecture available. It is supported by a good lot of community members who regularly update the code and improve the architecture. Anyone can craft their own monitoring and alerting tool using their extensible and flexible open code.
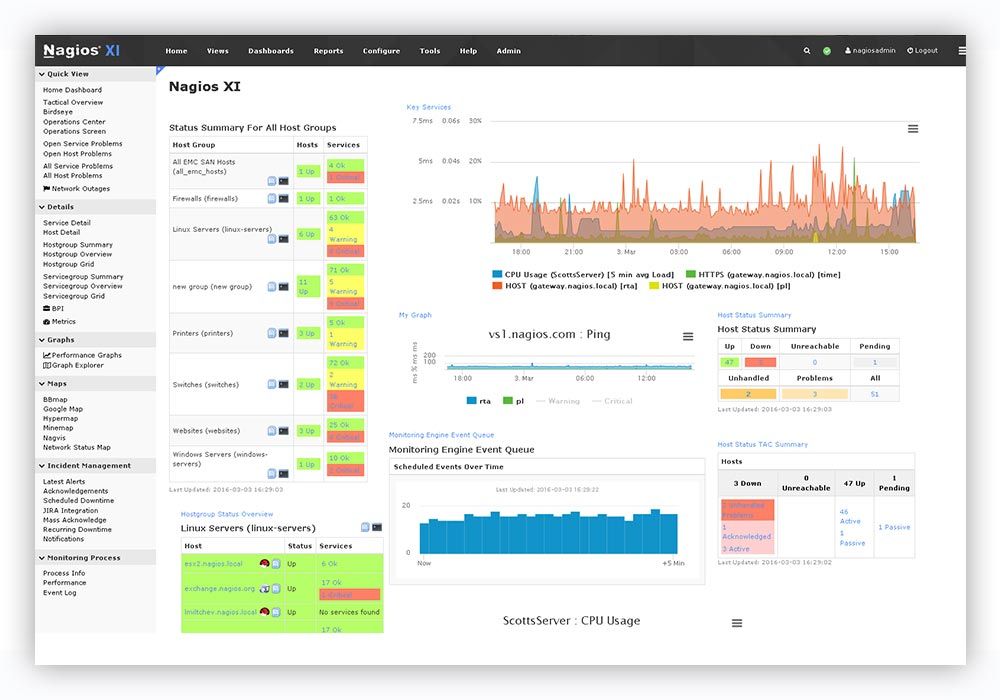
Feature Highlights:
- Open-source monitoring solution with a robust ecosystem of plugins
- Offers extensive monitoring capabilities for network devices, servers, applications, and services
- Supports customizable alerting and notification features based on predefined thresholds and conditions
- Provides detailed performance graphs and reports for trend analysis and capacity planning
- Flexible and extensible architecture with support for distributed monitoring setups
Best Closed Source Linux Monitoring Tools
So far, we have looked at open-source linux monitoring tools. The beauty of these lies in the fact that they are all easily accessible, but that also means lesser add-ons. For example, scalability, the load it can take, retention rate, customizable features etc. won’t be available in free versions. That is why most of the solutions offer products in tiers, like standard and enterprise level where you can tailor out only features that you need at a cost. Below listed are some tools like that, where you pay but get a good deal in the end!
1. Atatus
Atatus is a full-stack monitoring and observability platform. As part of its product line, it hosts an incredible Infrastructure Monitoring solution. With its easy-to-set-up and intuitive interface, they capture every minute metrics of your application platform.
Atatus Infrastructure Monitoring provides real-time visibility into the health and performance of your CPU, servers, containers, and other infrastructure components. It helps you identify and resolve issues before they impact your users.

Feature Highlights:
- Monitor all infrastructure components - whether deployed locally, on cloud or hybrid.
- Easy installation with the Atatus Infra agent curated for different OS.
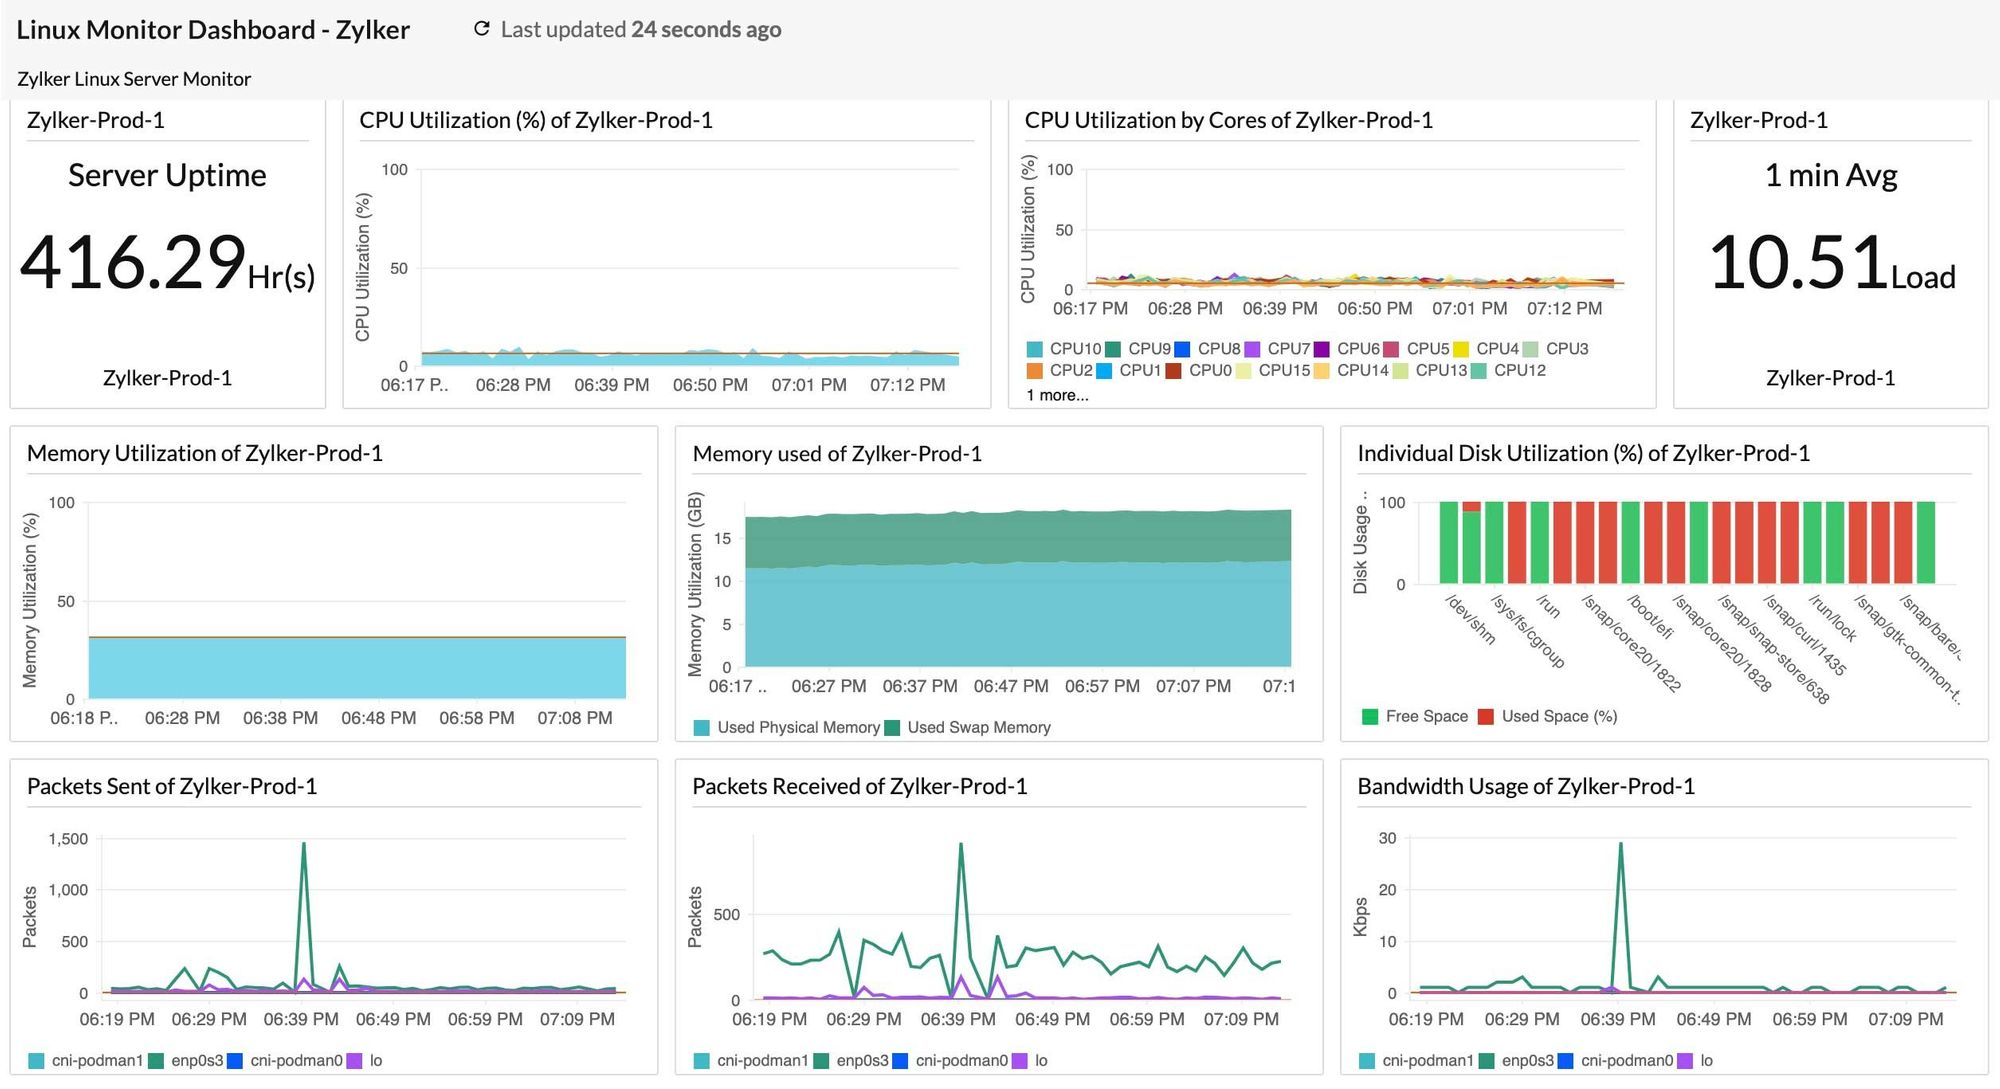
- Get to know granular insights on CPU usage:
- CPU used% - resources actively being used by processes
- idle % - represents the portion of CPU resources that are currently not being utilized by any processes
- I/O wait time - amount of time the CPU spends waiting for I/O operations to complete
- Steal % - amount of CPU time that is stolen from a virtual machine by the hypervisor in a virtualized environment.
- Track the health and availability of your Linux Servers.
- Asses memory situation with metrics on total memory used, free space, etc. and get to know the condition of your Swap memory in Linux servers.
- Coming to the Network strength - gauge minute details on in and out request processing strength in bytes or packets and learn about the requests that returned an error or were dropped from your Linux servers.
Discover the essential metrics for peak infrastructure performance in Atatus' comprehensive guide to Infrastructure Monitoring Metrics.
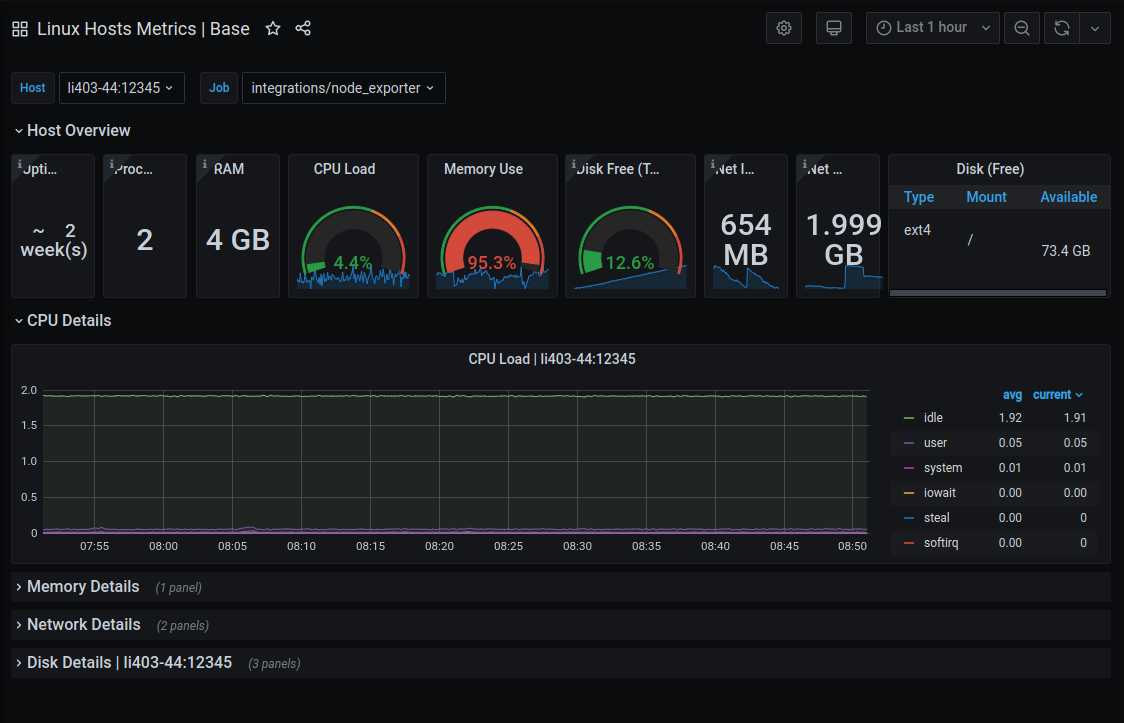
2. Elastic Stack
Elastic Stack is a suite of open-source products including Elasticsearch, Logstash, and Kibana, which can be used together for log management, monitoring, and analytics. While the core components are open-source, there are additional features and services offered by Elastic that are commercial.
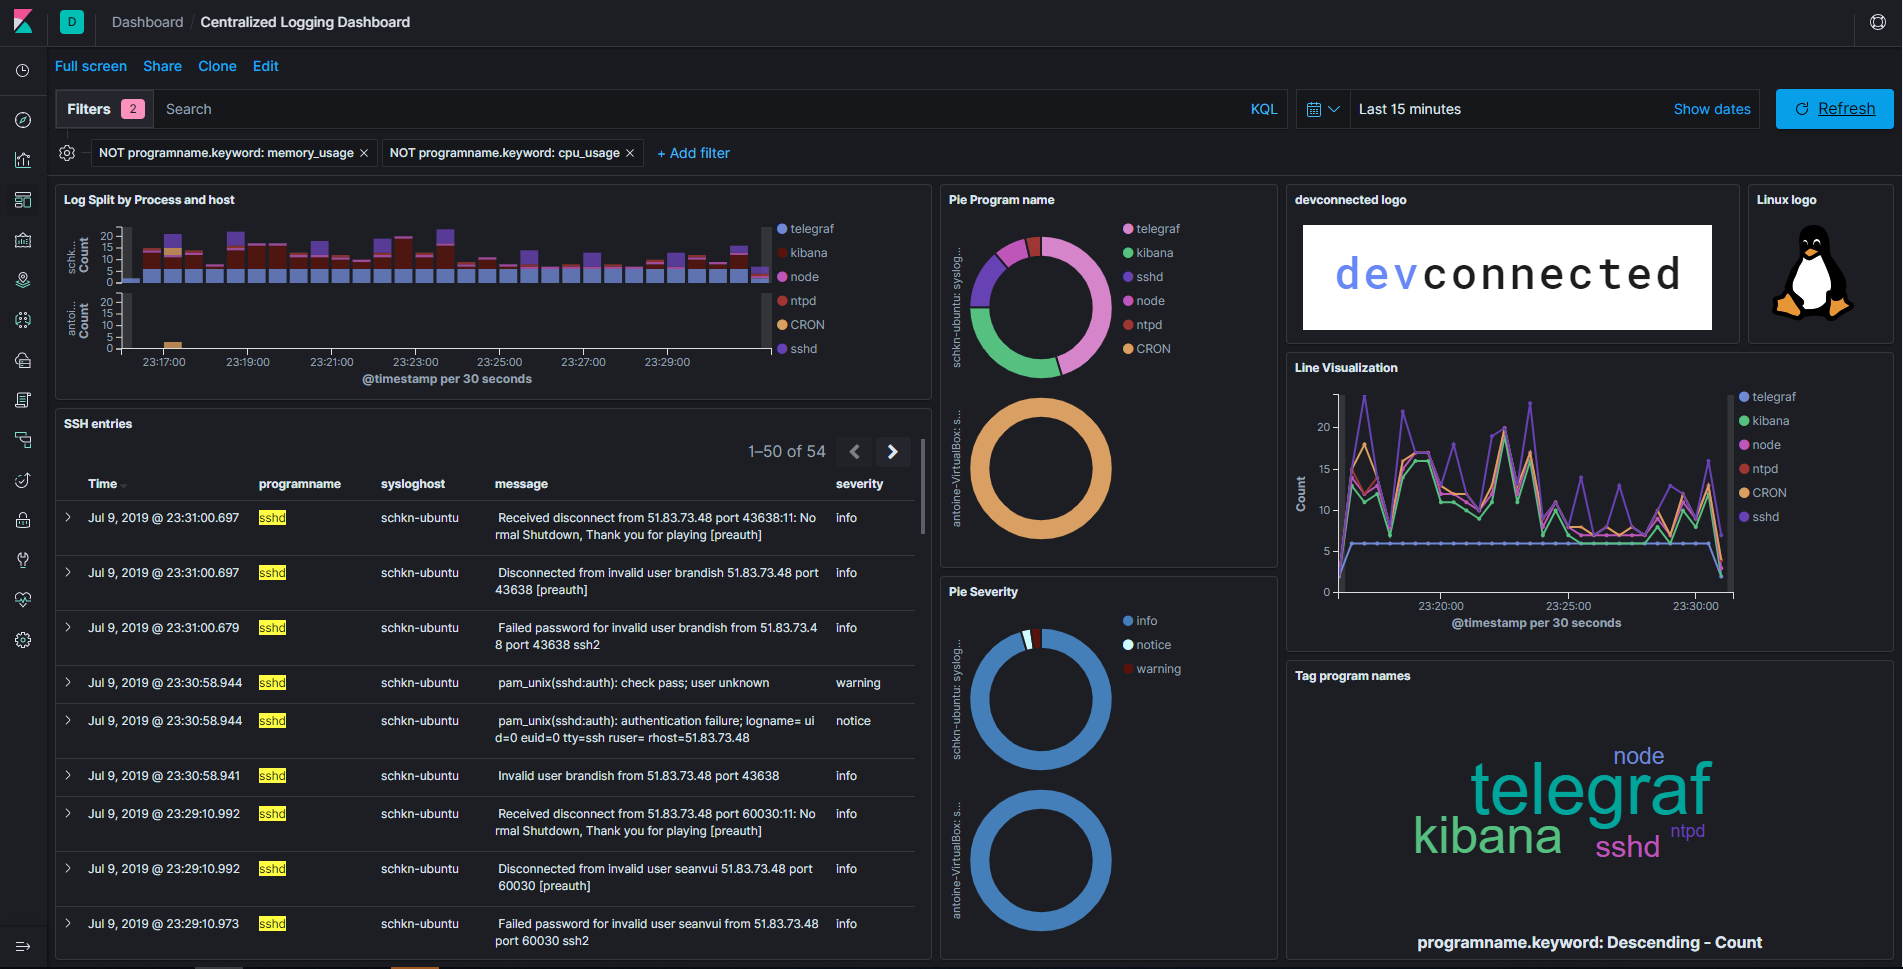
Feature Highlights:
- Comprehensive monitoring and analytics platform
- Offers Elasticsearch for data storage, Logstash for log collection and processing, and Kibana for data visualization and analysis
- Provides real-time insights into system performance, logs, and application metrics
- Supports integration with various data sources and third-party plugins
- Scalable and customizable solution suitable for small to large-scale environments
3. SolarWinds
SolarWinds offers a range of network management and monitoring solutions, including tools for infrastructure monitoring, network performance monitoring, and application performance monitoring. SolarWinds' solutions are closed-source but are widely used in enterprise environments for their comprehensive feature set and scalability.
Feature Highlights:
- Enterprise-grade monitoring platform with a wide range of features
- Offers network, server, application, and infrastructure monitoring capabilities
- Includes features such as network performance monitoring, server health monitoring, and application performance monitoring (APM)
- Provides customizable dashboards, alerting, and reporting functionalities
- Offers scalability and integration with other SolarWinds products for comprehensive IT management
4. Passler PRTG
PRTG Network Monitor is a comprehensive network monitoring solution that offers monitoring of network devices, bandwidth, servers, applications, and more. It features an intuitive web-based interface and extensive alerting and reporting capabilities.
Feature Highlights:
- All-in-one network monitoring solution with a user-friendly interface
- Supports monitoring of networks, servers, applications, and services
- Offers auto-discovery and pre-configured sensors for quick setup and deployment
- Provides customizable dashboards, maps, and reports for monitoring and analysis
- Supports multi-platform monitoring, including Windows, Linux, and Unix systems
5. Site24x7
Site24x7 is a cloud-based monitoring solution that offers monitoring of websites, servers, applications, networks, and more. It provides real-time performance monitoring, alerting, and reporting, with support for both on-premises and cloud-based environments.
Feature Highlights:
- Cloud-based monitoring platform for infrastructure, applications, and user experience
- Offers monitoring of servers, networks, databases, websites, and cloud services
- Provides real-time insights into performance, availability, and response times
- Includes features such as synthetic transaction monitoring, real user monitoring (RUM), and log management
- Offers scalability, flexibility, and integration with other Site24x7 modules for end-to-end visibility
6. Datadog
Datadog is a cloud-based monitoring and analytics platform that provides monitoring of infrastructure, applications, logs, and more. It offers real-time visibility into the performance of cloud-scale applications and environments, with support for integrations with a wide range of technologies and services.
Feature Highlights:
- Cloud-native monitoring and analytics platform for infrastructure and applications
- Offers monitoring of servers, containers, databases, applications, and cloud services
- Provides real-time metrics, logs, and traces for troubleshooting and optimization
- Includes features such as anomaly detection, alerting, and collaboration tools
- Supports integration with over 400 technologies and third-party services for comprehensive monitoring and automation
7. ManageEngine OpManager
OpManager is a network monitoring solution that provides monitoring of network devices, servers, virtual machines, and more. It offers features such as auto-discovery, performance monitoring, and customizable dashboards, with support for both on-premises and cloud-based deployments.
Feature Highlights:
- Integrated network management software with monitoring, configuration, and troubleshooting capabilities
- Offers network performance monitoring, bandwidth analysis, and fault management
- Supports monitoring of servers, applications, virtual machines, and cloud resources
- Provides customizable dashboards, alerting, and reporting functionalities
- Offers scalability and integration with other ManageEngine products for unified IT management
8. Sematext
Sematext offers monitoring and log management solutions for infrastructure, applications, and logs. It provides real-time monitoring, alerting, and analytics, with support for cloud-native environments, microservices, and containerized applications.
Feature Highlights:
- Cloud monitoring and log management platform for infrastructure and applications
- Offers monitoring of servers, containers, databases, and microservices
- Provides real-time metrics, logs, and traces for troubleshooting and optimization
- Includes features such as anomaly detection, alerting, and root cause analysis
- Supports integration with various data sources and third-party services for comprehensive monitoring and analysis
Conclusion
Effective monitoring of Linux systems is essential for maintaining system health, optimizing performance, ensuring availability, and enhancing security.
The tools mentioned above offer a wide range of features and capabilities, making them essential for monitoring and maintaining the health and performance of your Linux systems. From system resource monitoring to network and application monitoring, these tools provide comprehensive insights and alerts to ensure your systems are running smoothly.
Investing in these top 15 Linux monitoring tools will not only save you time and effort, but also help you proactively identify and resolve issues before they impact your operations. With these tools at your disposal, you can confidently manage and monitor your Linux environment with ease.
Infrastructure Monitoring with Atatus
Track the availability of the servers, hosts, virtual machines and containers with the help of Atatus Infrastructure Monitoring. It allows you to monitor, quickly pinpoint and fix the issues of your entire infrastructure.
In order to ensure that your infrastructure is running smoothly and efficiently, it is important to monitor it regularly. By doing so, you can identify and resolve issues before they cause downtime or impact your business.
It is possible to determine the host, container, or other backend component that failed or experienced latency during an incident by using an infrastructure monitoring tool. In the event of an outage, engineers can identify which hosts or containers caused the problem. As a result, support tickets can be resolved more quickly and problems can be addressed more efficiently.
Start your free trial with Atatus. No credit card required.


